시계열 데이터에서 특이점 마이닝하기
Anomaly Detection 원본
Reference
Vallis, O., Hochenbaum, J. and Kejariwal, A., (2014) "A Novel Technique for Long-Term Anomaly Detection in the Cloud", 6th USENIX, Philadelphia, PA.
Twitter Team이 계절적 변동이 예견되는 가운데 무엇인가 특이한 지점을 여러 개(!) 지정하여 찾아내는 새로운 데이터마이닝 알고리즘을 제안했다.
먼저 Rtools를 설치한다.AnomalyDetection이 아직 CRAN에 등록되지 않아서 귀찮지만 build를 해야 한다.
Rtools 설치 링크
load_package <- function() {
if (! require("RJSONIO")) {
install.packages("RJSONIO")
require("RJSONIO")
}
if (! require("RCurl")) {
install.packages("RCurl")
require("RCurl")
}
if (! require("devtools")) {
install.packages("devtools")
require("devtools")
}
devtools::install_github("twitter/AnomalyDetection") #GitHub로부터 바로 인스톨
library(AnomalyDetection)
}
load_package()
# 아마 이것은 없을 듯하여..
page <- "USA"
raw_data <- getURL(paste("http://stats.grok.se/json/en/latest90/", page, sep=""))
# JSON데이터를 받아온다.
data <- fromJSON(raw_data)
# list로 반환된 데이터
views <- data.frame(timestamp=paste(names(data$daily_views), " 12:00:00", sep=""), stringsAsFactors=F)
views$count <- data$daily_views
# view에 timestamp를 찍고(12:00:00로 고정), count를 옮긴다.
views$timestamp <- as.POSIXlt(views$timestamp)
# Transform to POSIX datetime
views <- views[order(views$timestamp),]
# 시간 순서로 정리
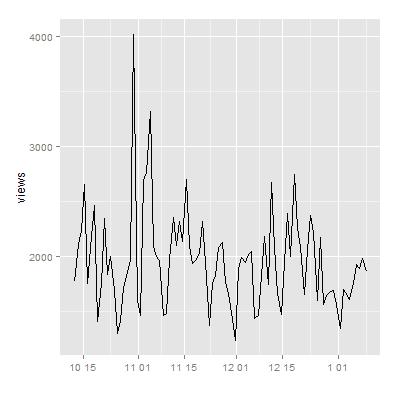
ggplot(views, aes(timestamp, count)) + geom_line() + scale_x_datetime() + xlab("") + ylab("views")
# line plot을 그리고,
# x축은 datetime으로 정의, 라벨은 X에 "" Y에 "views"라고 하자.
# Twitter 개발팀이 개발한 Seasonal Hybrid ESD (S-E-ESD) 알고리즘
# identifying local anomalies (= variations inside seasonal patterns)
# global anomalies (=variations cannot be explained by seasonal patterns)
res = AnomalyDetectionVec(views$count,
max_anoms=0.05,
direction='both',
plot=TRUE, period=7)
# direction = "pos", "neg", "both
# period := 한 시즌 토막의 길이, 1주일 단위로 seasonal하다 가정하자.
res$plot
views[res$anoms[[1]],]

> views[res$anoms[[1]],]
timestamp count
61 2014-10-30 12:00:00 4016
84 2014-11-02 12:00:00 2691
90 2014-11-04 12:00:00 3318
41 2014-11-15 12:00:00 2697
2014년 10월 30일, 11월 2일, 11월 4일, 11월 15일에 이상점이 관측되었다.
Reference
Vallis, O., Hochenbaum, J. and Kejariwal, A., (2014) "A Novel Technique for Long-Term Anomaly Detection in the Cloud", 6th USENIX, Philadelphia, PA.
Reference
Vallis, O., Hochenbaum, J. and Kejariwal, A., (2014) "A Novel Technique for Long-Term Anomaly Detection in the Cloud", 6th USENIX, Philadelphia, PA.
Twitter Team이 계절적 변동이 예견되는 가운데 무엇인가 특이한 지점을 여러 개(!) 지정하여 찾아내는 새로운 데이터마이닝 알고리즘을 제안했다.
먼저 Rtools를 설치한다.AnomalyDetection이 아직 CRAN에 등록되지 않아서 귀찮지만 build를 해야 한다.
Rtools 설치 링크
load_package <- function() {
if (! require("RJSONIO")) {
install.packages("RJSONIO")
require("RJSONIO")
}
if (! require("RCurl")) {
install.packages("RCurl")
require("RCurl")
}
if (! require("devtools")) {
install.packages("devtools")
require("devtools")
}
devtools::install_github("twitter/AnomalyDetection") #GitHub로부터 바로 인스톨
library(AnomalyDetection)
}
load_package()
# 아마 이것은 없을 듯하여..
page <- "USA"
raw_data <- getURL(paste("http://stats.grok.se/json/en/latest90/", page, sep=""))
# JSON데이터를 받아온다.
data <- fromJSON(raw_data)
# list로 반환된 데이터
views <- data.frame(timestamp=paste(names(data$daily_views), " 12:00:00", sep=""), stringsAsFactors=F)
views$count <- data$daily_views
# view에 timestamp를 찍고(12:00:00로 고정), count를 옮긴다.
views$timestamp <- as.POSIXlt(views$timestamp)
# Transform to POSIX datetime
views <- views[order(views$timestamp),]
# 시간 순서로 정리
ggplot(views, aes(timestamp, count)) + geom_line() + scale_x_datetime() + xlab("") + ylab("views")
# line plot을 그리고,
# x축은 datetime으로 정의, 라벨은 X에 "" Y에 "views"라고 하자.
# Twitter 개발팀이 개발한 Seasonal Hybrid ESD (S-E-ESD) 알고리즘
# identifying local anomalies (= variations inside seasonal patterns)
# global anomalies (=variations cannot be explained by seasonal patterns)
res = AnomalyDetectionVec(views$count,
max_anoms=0.05,
direction='both',
plot=TRUE, period=7)
# direction = "pos", "neg", "both
# period := 한 시즌 토막의 길이, 1주일 단위로 seasonal하다 가정하자.
res$plot
views[res$anoms[[1]],]
> views[res$anoms[[1]],]
timestamp count
61 2014-10-30 12:00:00 4016
84 2014-11-02 12:00:00 2691
90 2014-11-04 12:00:00 3318
41 2014-11-15 12:00:00 2697
2014년 10월 30일, 11월 2일, 11월 4일, 11월 15일에 이상점이 관측되었다.
Reference
Vallis, O., Hochenbaum, J. and Kejariwal, A., (2014) "A Novel Technique for Long-Term Anomaly Detection in the Cloud", 6th USENIX, Philadelphia, PA.

공유해 주신 예제를 돌려보았는데 과정에서 에러가 있네요 도움 주실 수 있나요?
답글삭제> views <- data.frame(timestamp=paste(names(data$daily_views), " 12:00:00", sep=""), stringsAsFactors=F)
>
> views$count <- data$daily_views
Error in `$<-.data.frame`(`*tmp*`, "count", value = list()) :
replacement has 0 rows, data has 1
>
> views$timestamp <- as.POSIXlt(views$timestamp)
Error in as.POSIXlt.character(views$timestamp) :
문자열이 표준서식을 따르지 않습니다
>
> views <- views[order(views$timestamp),]
>
> ggplot2(views, aes(timestamp, count)) + geom_line() + scale_x_datetime() + xlab("") + ylab("views")
에러: 함수 "ggplot2"를 찾을 수 없습니다
데이터에 문제가 있어서 에러가 발생했습니다. stats.grok.se 사이트가 작동을 하지 않기 때문에 다른 데이터로 예제를 수정해야 할 듯요. 그리고 ggplot2는 package로 설치해줘야 한답니다. 코드에서 ggplot2는 ggplot이라고 해야 하고 ggplot2 패키지를 설치해야 합니다.
삭제